![[Previous]](prev.gif) |
![[Contents]](contents.gif) |
![[Index]](keyword_index.gif) |
![[Next]](next.gif) |
|
|
|
|
 |
This version of this document is no longer maintained. For the latest documentation, see http://www.qnx.com/developers/docs. |
You can select a topic from this diagram:
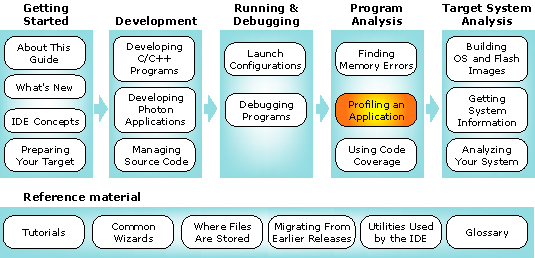
This chapter shows you how to use the application profiler.
In this chapter:
The QNX Application Profiler perspective lets you examine the overall performance of programs, no matter how large or complex, without following the source one line at a time. Whereas a debugger helps you find errors in your code, the QNX Application Profiler helps you pinpoint "sluggish" areas of your code that could run more efficiently.
The QNX Application Profiler perspective.
The QNX Application Profiler lets you perform:
The QNX Application Profiler takes "snapshots" of your program's execution position every millisecond and records the current address being executed. By sampling the execution position at regular intervals, the tool quickly builds a summary of where the system is spending its time in your code.
With statistical profiling, you don't need to use instrumentation, change your code, or do any special compilation. The tool profiles your programs unintrusively, so it doesn't bias the information it's collecting.
Note, however, that the results are subject to statistical inaccuracy because the tool works by sampling. Therefore, the longer a program runs, the more accurate the results.
If you build your executables with profiling enabled, the QNX Application Profiler can provide call-pair information (i.e. which functions called which). When you build a program with profiling enabled, the compiler inserts snippets of code into your functions in order to report the addresses of the called and calling functions. As your program runs, the tool produces an exact count for every call pair.
The IDE lets you examine profiling information from a gmon.out file produced by an instrumented application. The tool gives you all the information you'd get from the traditional gprof tool, but in graphical form. You can examine gmon.out files created by your programs, whether you built them using the IDE or the qcc -p command. For more on the gprof utility, go to www.gnu.org; for qcc, see the Utilities Reference.
Whether you plan to do profiling in real time or postmortem (using a gmon.out file), you should build your programs with profiling enabled before starting a profiling session.
This section includes these topics:
Although you can profile any program, you'll get the most useful results by profiling executables built for debugging and profiling. The debug information lets the IDE correlate executable code and individual lines of source; the profiling information reports call-pair data.
 |
Profiling is handled by functions in libc; be sure to check our website for libc updates from time to time. |
This table shows the application-profiling features that are possible with the various build variants:
| Feature | Release version | Debug version | Release v. & profiling | Debug v. & profiling |
|---|---|---|---|---|
| Call pairs | No | No | Yes | Yes |
| Statistical sampling | Yes (function level) | Yes | Yes (function level) | Yes |
| Line profiling | No | Yes | No | Yes |
| Postmortem profiling | No | No | Yes | Yes |
To build executables with debug information and profiling enabled:
|
The QNX Application Profiler uses the information in the debuggable executables to correlate lines of code in your executable and the source code. To maximize the information you get while profiling, use executables with debug information for both running and debugging. |
|
To build a Standard Make C/C++ project for profiling, compile and link
using the -p option. For example, your Makefile
might have a line like this:
CFLAGS=-p CXXFLAGS=-p LDFLAGS=-p |
To run and profile a process, with qconn on the target:
|
To produce full profiling information with function timing data,
you need to run the
application as root. This is the case when
running through qconn.
If you run the application as a normal user, the profiler can generate only call-chain information. |
To profile a process that's already running on your target:
|
When you profile a running process, you can't use the Console view in the IDE to interact with this process. If your running process requires user input through the Console view, use a shell to interact with the process. |
|
Your running application won't generate call-pair information unless
you ran it with the QCONN_PROFILER environment variable
set to /dev/profiler.
If you're launching the application from the IDE, add QCONN_PROFILER to the Environment tab of the launch configuration's Properties dialog. If you're running the application from the command line, you can simply add QCONN_PROFILER to your shell environment, or the application's command-line: QCONN_PROFILER=/dev/profiler ./appname |
The IDE lets you profile your program after it terminates, using the traditional gmon.out file. Postmortem profiling doesn't provide as much information as profiling a running process:
Profiling a gmon.out file involves three basic steps:
The IDE lets you store your profiling information in the directory of your choice using the PROFDIR environment variable.
To gather profiling information:
|
You must have the QNX Application Profiler tool disabled in your launch configuration. |
You can bring existing gmon.out files that you created outside the IDE into your workspace from your target system.
To import a gmon.out file into your workspace:
To start the postmortem profiling session:
The Application Profiler view () lets you control multiple profiling sessions simultaneously. You can:
The Application Profiler view displays the following as a hierarchical tree for each profiling session:
| Session item | Description | Possible icons |
|---|---|---|
| Launch instance | Launch configuration name and launch type (e.g. prof201 [C/C++ QNX QConn (IP)]) | |
| Profiled program | Project name and start time (e.g. prof201 on localhost pid 4468773 (3/4/03 12:41 PM)) | |
| Application Profiler instance | Program name and target computer (e.g. Application Profiler Attached to: prof201 <4468773> on 10.12.3.200) | |
| Executable | ||
| Shared libraries | ||
| DLLs | ||
| Unknown | |
To terminate an application running on a target:
|
To clear old launch listings from this view, click the
Remove All Terminated Launches button ( |
To disconnect from an application running on a target:
|
To clear old launch listings from this view, click the
Remove All Terminated Launches button ( |
For each item you select in the Application Profiler view, other views within the QNX Application Profiler perspective display the profiling information for that item:
| This view: | Shows: |
|---|---|
| Application Profiler | Usage by line |
| Sampling Information | Usage by function |
| Thread Processor Usage | Usage by thread |
| Call Information | Call counts |
The Application Profiler editor lets you see the amount of time your program spends on each line of code and in each function.
To open the editor:
|
You may get incorrect profiling information if you change your source after compiling, because the Application Profiler editor relies on the line information provided by the debuggable version of your code. |
The Application Profiler editor displays a bar graph on the left side. The bars are color coded:
The Sampling Information view shows a flat profile of the item that's currently selected in the Application Profiler view. You can examine profiling information for programs, shared libraries, and DLLs:
The view lists all the functions called in the selected item. For each function, this view displays:
If you select a program compiled for profiling, the view also displays:
To see your function usage:
The Thread Processor Usage view displays the CPU usage (in seconds and as a percentage of your program's total time) for each thread of the item that's currently selected in the Application Profiler view:
You can use this information to:
To see your thread usage:
For the item that's currently selected in the Application Profiler view, the Call Information view shows your call counts in three panes:
To display your call counts:
The Call Pairs pane shows you where every function was called from as well as the call-pair count, i.e. the number of times each function called every other function.
The Call Graph pane shows you a graph of the function calls. Your selected function appears in the middle, in blue. On the left, in yellow, are all the functions that called your function. On the right, also in yellow, are all the functions that your function called.
or:
|
You can display the call graph only for functions that were compiled with profiling enabled. |
The Call Pair Details pane shows the information about the function you've selected in the Call Graph pane. The Caller and Call Count columns show the number of times each function called the function you've selected.
The Called and Called Count columns show the number of times your selected function called other functions. This pane shows only the functions that were compiled with profiling. For example, it doesn't show calls to functions, such as printf(), in the C library.
|
|
|
|